
Campaign analytics uses data to check how well marketing is doing, analyzing customer behavior and metrics to improve campaigns.
Campaign analytics is the process of using data to evaluate how well marketing campaigns are performing. It involves collecting and analyzing data to understand customer behavior, measure key metrics, and make informed decisions to improve campaigns.
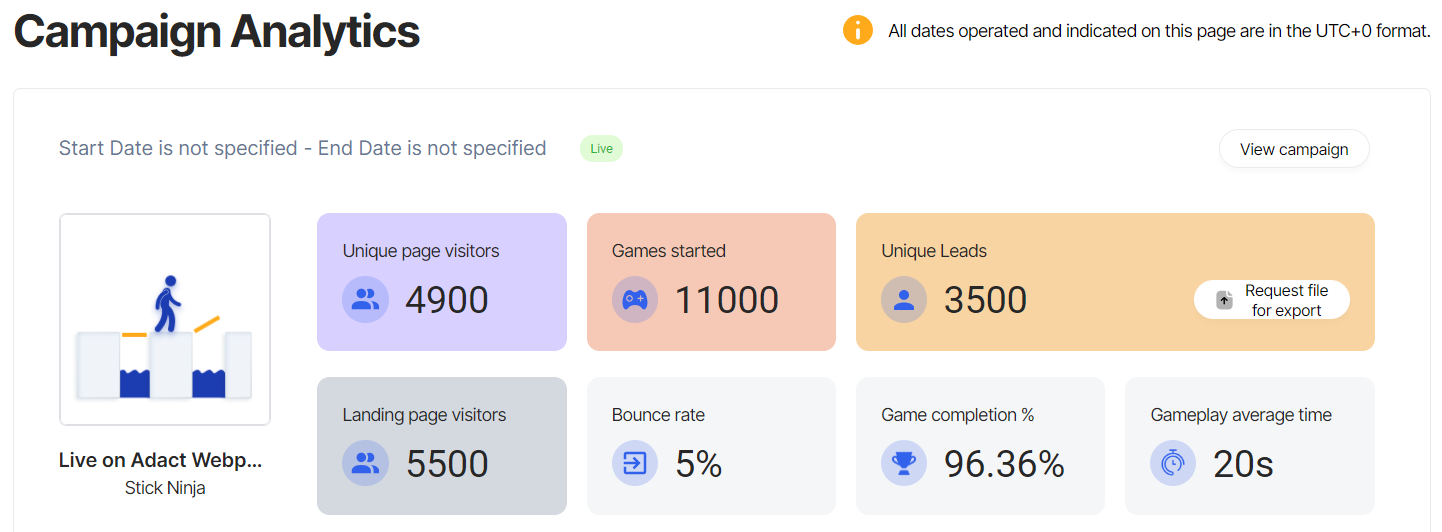
Unique page visitors refer to the number of individuals who have visited a particular webpage within a specific time frame. It counts each visitor only once, regardless of how many times they may have visited the page during that period.
Landing page visitor is someone who arrives at your web page designed for a particular campaign.
Games started shows how many times the game was started.
The bounce rate refers to the percentage of visitors who leave a campaign's website or landing page without further engagement or playing the game.
Game completion % shows how many % of people completed the game.
Unique leads are individuals who have willingly provided their information through a registration form.
Gameplay average time refers to the typical amount of time players spend actively playing a game.
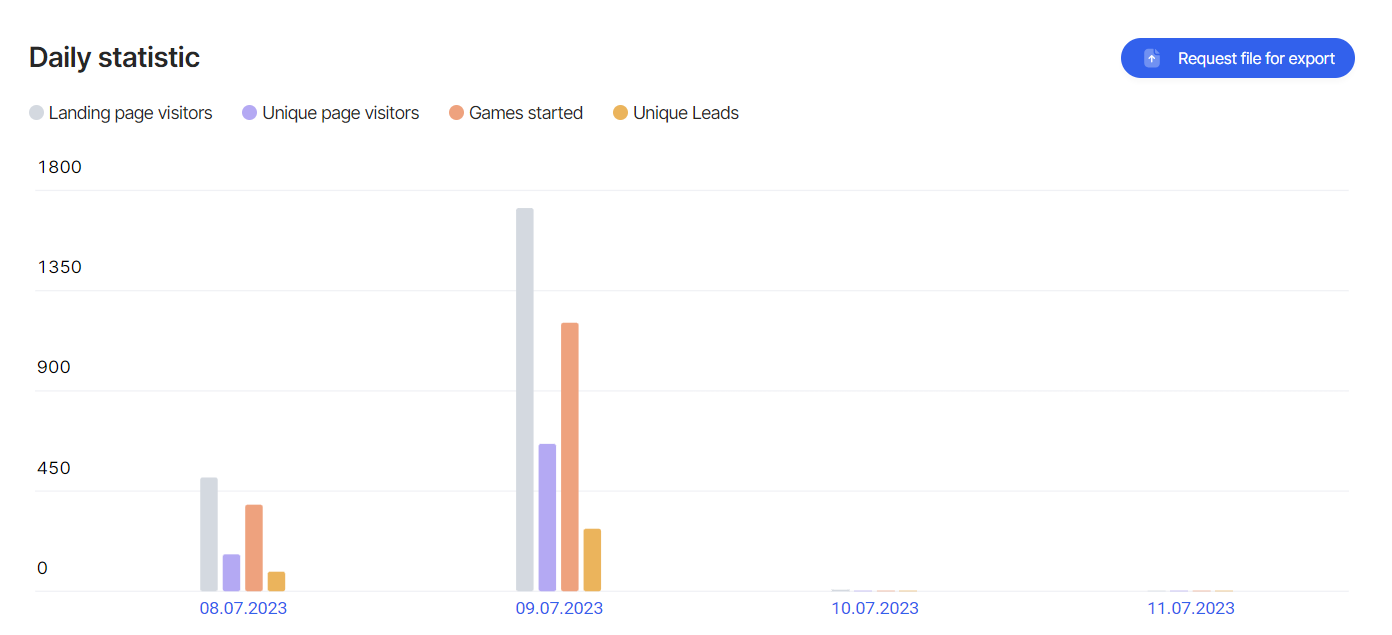
Daily Statistics
Daily statistics in campaign analytics provide valuable numbers and information that indicate the performance of a marketing campaign on a daily basis. These statistics involve tracking key metrics like the number of landing page visitors, unique page visitors, games started, and unique leads.
To access more detailed information, you can easily download an CSV or XLSX file by clicking on "Request file for export."
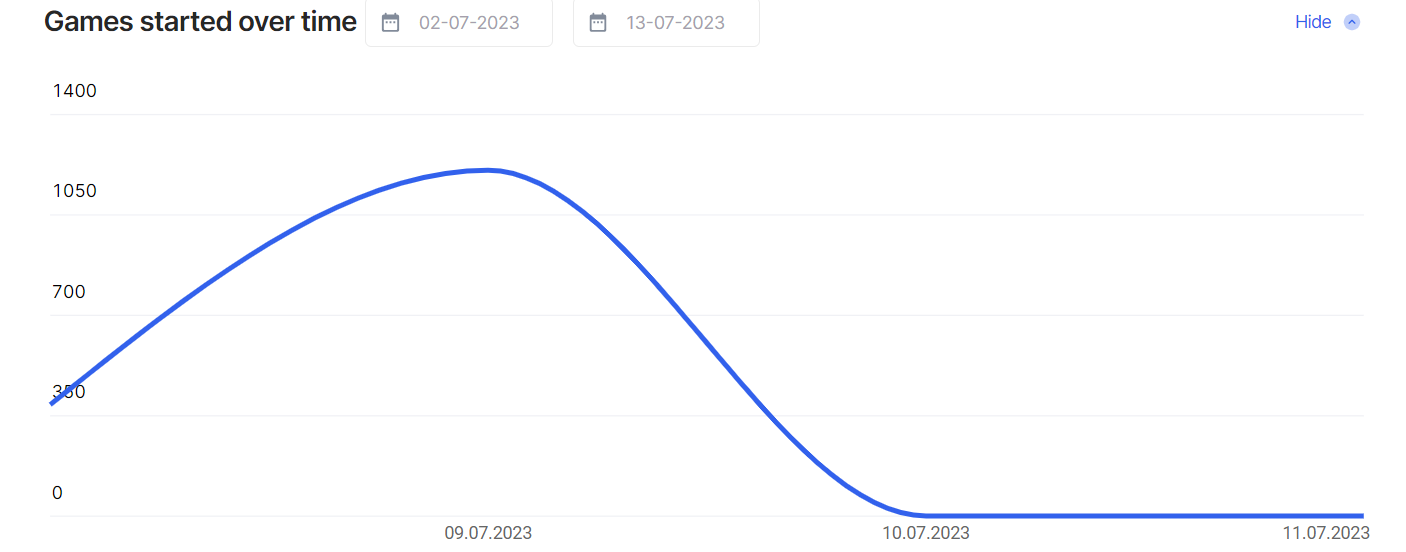
Games started over time
Games started over time in campaign analytics reveal the number of games started each day. By clicking on the dates, you can explore the specific time period and view the corresponding data for game starts.
Most active players
Most active players show how often players play the game on average. It also highlights the individuals who have played the game the most and how many times they have played.

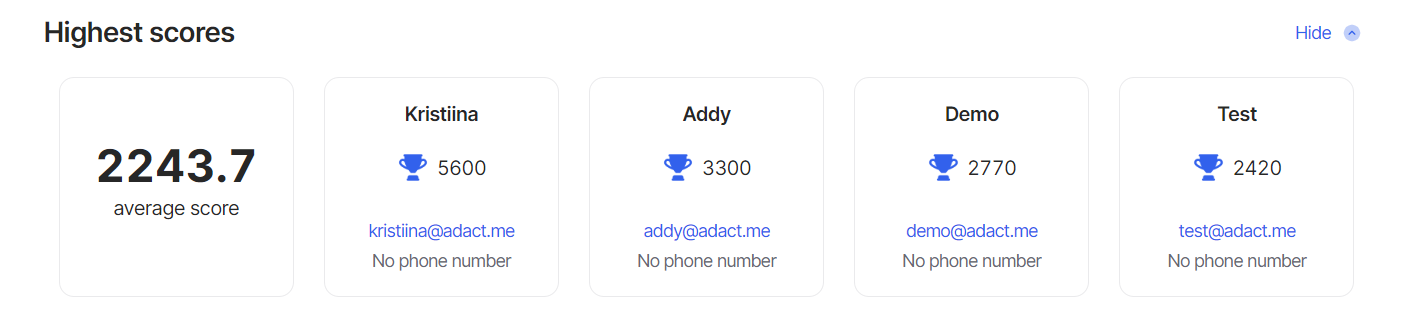
Highest score
The highest scores display the average score achieved by players. In addition, it showcases the individuals who have achieved the top score, along with their contact information.
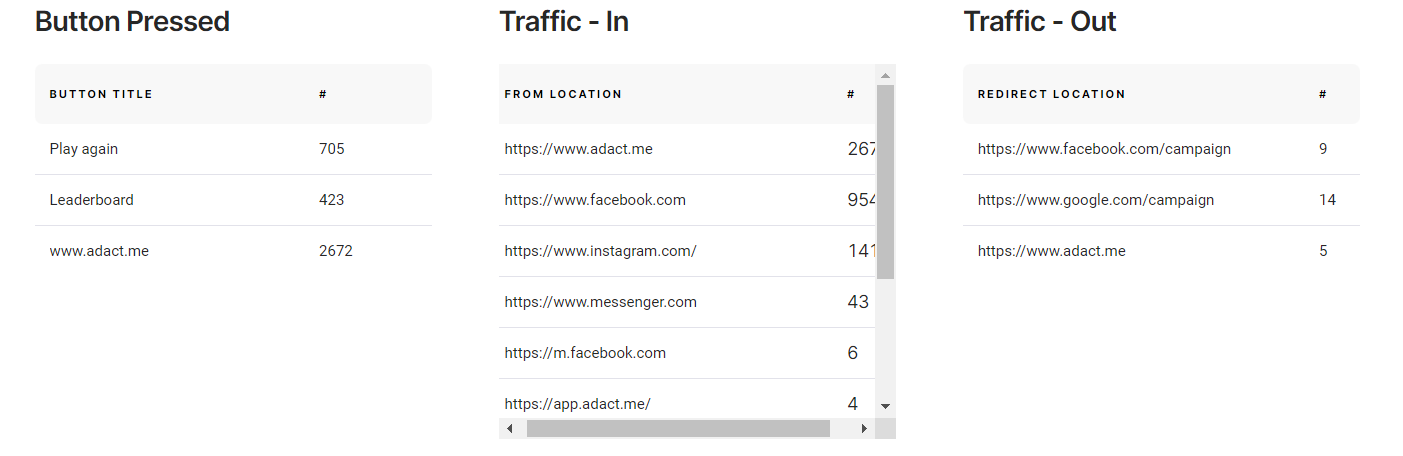
Detailed information for button pressed, traffic in and out
"Button pressed" in campaign analytics refers to tracking how many times a specific button or call-to-action has been clicked by users.
"Traffic in" in campaign analytics refers to the number of visitors or users who come to a webpage or website as a result of a marketing campaign or promotion. It helps measure the success of the campaign in attracting visitors to the intended destination.
"Traffic out" in campaign analytics refers to the number of users who leave a webpage or website to visit other destinations. It helps measure user behavior and indicates how successful a webpage is at keeping users engaged.
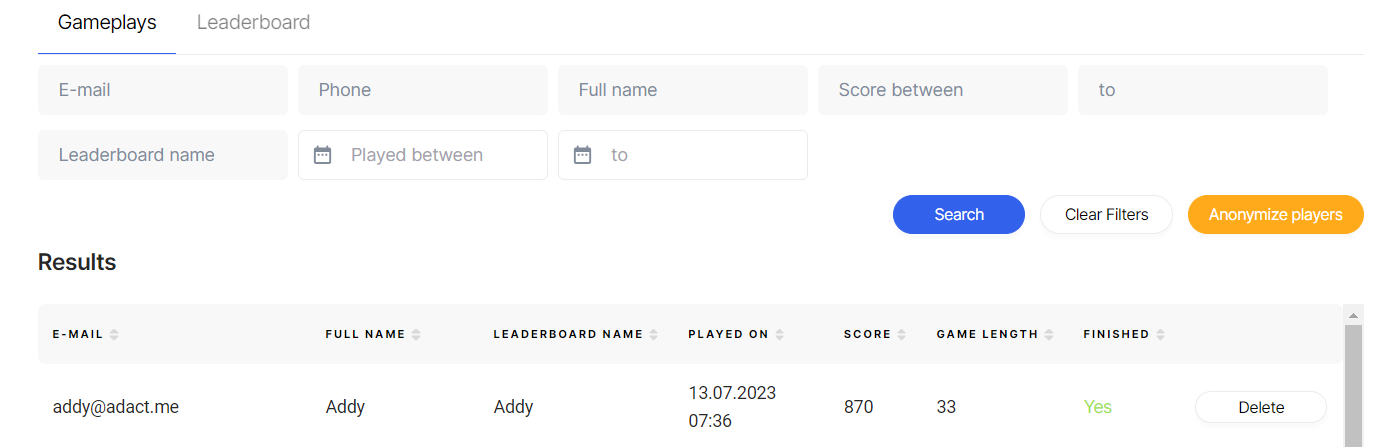
Results
If you're looking for specific information about a player, you can easily find it by clicking on the Gameplays. From there, you can search for the player using their email, phone number, full name, score, leaderboard name, or even their playing time.
The Leaderboard tab offers the ability to search for specific individuals based on their leaderboard name, score, or the duration of time they have played the game.
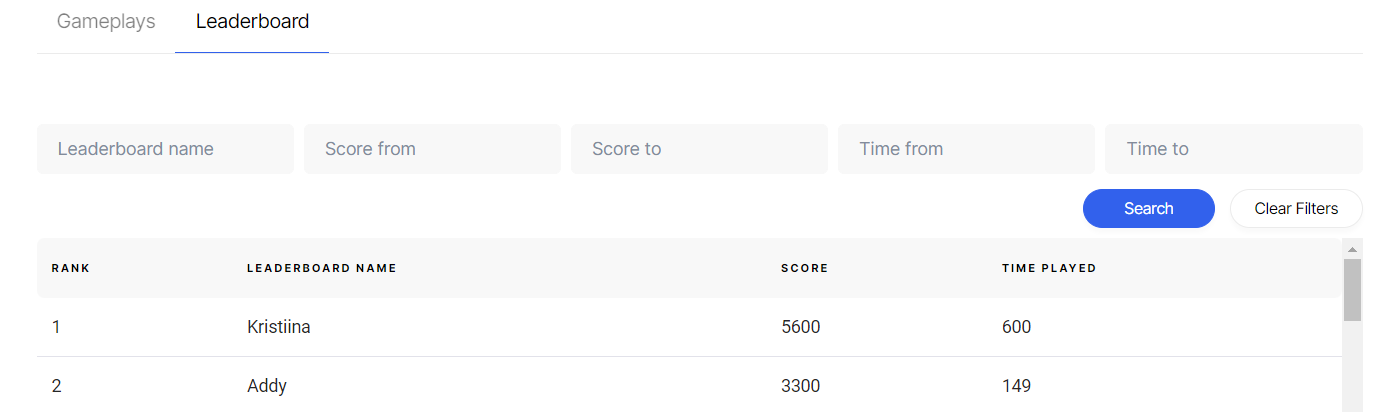
Click here to read how to add a leaderboard to your campaign.
How to find out if your campaign has cheaters?
Toggle on the "Cheated gameplays", click "Search" and you'll see a list of participants who cheated. Hover over the 'i' icon to learn why they were marked as cheaters.
Players who appear in the list won't receive prizes, and their names won't appear on the leaderboard.